


 48 / 94

48
Ces Urol 2015; 19(1): 44–50
ORIGINÁLNÍ PRÁCE
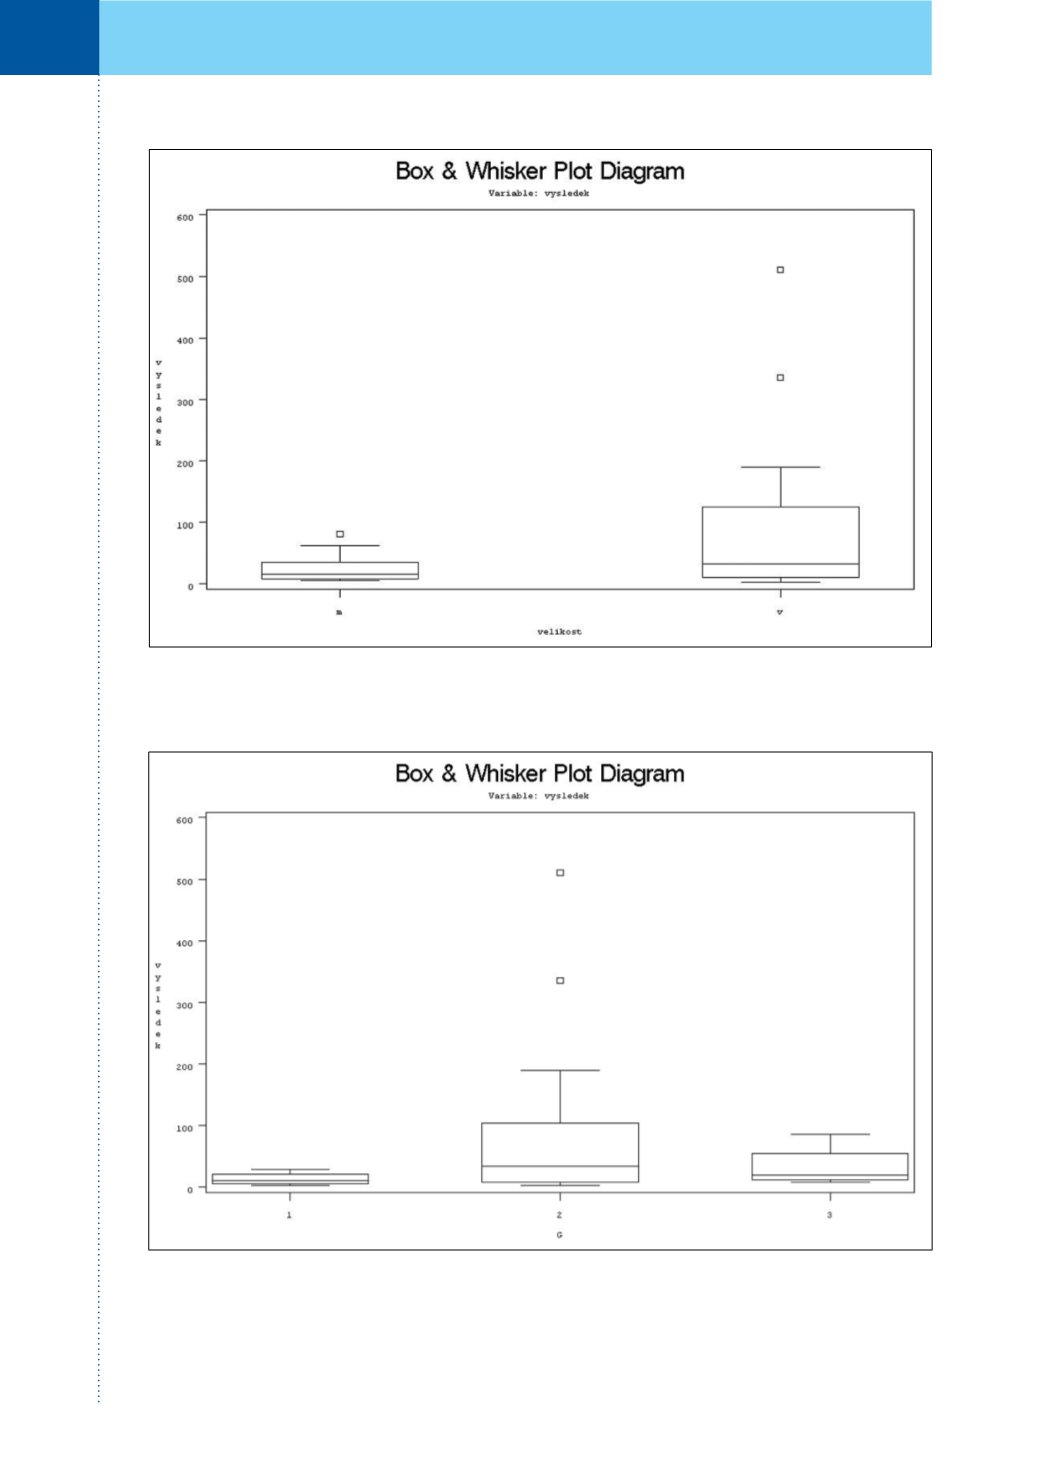
Graf 2.
Průměrné hodnoty TATI u pacientů s tumorem do 3 cm (m) a u větších než 3 cm (v)
Graph 2.
The mean TATI level in patiens with tumour size up to 3 cm (m) and more than 3 cm (v)
Graf 3.
Průměrné hodnoty TATI v závislosti na rozdílném stupni buněčné diferenciace
Graph 3.
The mean TATI level according to tumour grade